What fraction of players rated over 700?

mikepage

AzB Silver Member
Silver Member
In another thread some are discussing what fraction of players
--might have once, or
--are capable of, or
--regularly

run 100 balls in straight pool

and the discussion brings home the difficulty of deciding who is a "player." Is it someone who has picked up a pool cue once in the last 6 months? Someone with an established Fargo Rating? The answer will depend tremendously on this choice.

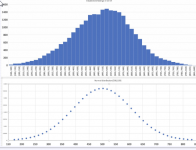
Here are a few stats from the FargoRate database that illustrate the problem. The bolded part refers to players with an established rating, though outside the somewhat arbitrary choice of 200 as "established, " it is clear there is nothing special here. Better players play more and are more likely to have games that made it into our database. As more players come in, these distributions will shift.


The number of people with 50 or more games is 72,338.
average performance rating is 463
standard deviation is 121, meaning two thirds are between 342 and 584
1.9% are over 700

The number of people with 100 or more games is 47,423.
average performance rating is 479
standard deviation is 115, meaning two thirds are between 364 and 594
2.2% are over 700

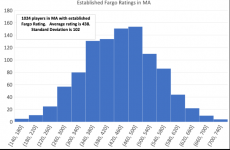
The number of people with 200 or more games is 26,477.
average performance rating is 500
standard deviation is 109, meaning two thirds are between 391 and 609
3.0% [785 players] are over 700


The number of people with 400 or more games is 13,205.
average performance rating is 523
standard deviation is 105, meaning two thirds are between 418 and 628
4.4% [ 589 players] are over 700

The number of people with 800 or more games is 5411.
average performance rating is 550
standard deviation is 103, meaning two thirds are between 447 and 653
7.5% [ 409 players] are over 700
 

sjm

Older and Wiser
Silver Member
Are these pretty normally distributed? I would guess positive skew.

Without eyeballing the data and speaking in theoretical terms alone, the Central Limit Theorem suggests that, as the sample size is substantial here, the distribution should be roughly normal.
 

Dan_B

AzB Gold Member
Gold Member
Silver Member
..huh? what?

Being a stat is like… ah… cool,

...it's like.. one big family :crying:


:wink:
 

Bob Jewett

AZB Osmium Member
Staff member
Gold Member
Silver Member
... the difficulty of deciding who is a "player." Is it someone who has picked up a pool cue once in the last 6 months? Someone with an established Fargo Rating? The answer will depend tremendously on this choice. ...
Mike, have you ever tried to estimate the number of good players who are not in Fargo Rate? And is there any way to estimate the distribution for all 15 million US "core" (more than once per month) pool players? I'd guess that most of those 15 million rarely go into a pool hall.
 

skip100

AzB Silver Member
Silver Member
The ratings are logarithmically transformed so that will affect the skew pattern.
 

nine_ball6970

AzB Silver Member
Silver Member
It makes sense that the average rating would go up based on number of games played. Outside of leagues that are tracked, the better/more serious players will be playing in the bigger tournaments reported and will go deeper in the events that they do play in.
 

mikepage

AzB Silver Member
Silver Member
Are these pretty normally distributed? I would guess positive skew.

Here is the actual distrubution of established ratings compared to the bel curve
 

Attachments

  • estdist.png
    estdist.png
    82.4 KB · Views: 332
Last edited:

hang-the-9

AzB Silver Member
Silver Member
Mike, have you ever tried to estimate the number of good players who are not in Fargo Rate? And is there any way to estimate the distribution for all 15 million US "core" (more than once per month) pool players? I'd guess that most of those 15 million rarely go into a pool hall.

I would guess your standard player that does not even play in a league is a 100-200 Fargo. D players are in the 200s, but even a D is someone that is learning somewhat.
 

BRussell

AzB Silver Member
Silver Member
Wow that nails normality alright. It’s funny because I would expect pool ability to be positively skewed, with a floor where most non-players/beginners sit, and then a small number with very high scores. Maybe it’s the log transformation that skip100 mentions that makes it normal.

Mean = 500 and sd = 100 has a nice ring to it. Makes it easy to estimate your percentile. That’s the same as the SAT, at least in the past.
 

Bob Jewett

AZB Osmium Member
Staff member
Gold Member
Silver Member
Wow that nails normality alright. It’s funny because I would expect pool ability to be positively skewed, with a floor where most non-players/beginners sit, and then a small number with very high scores. Maybe it’s the log transformation that skip100 mentions that makes it normal.

Mean = 500 and sd = 100 has a nice ring to it. Makes it easy to estimate your percentile. That’s the same as the SAT, at least in the past.
If you look at the top players, a normal distribution doesn't fit perfectly. That number of players, mean and sigma (actually 109) predicts that 78 players will be 800+ but only 22 are. (You can get to 22 by changing the sigma to 95.)

I suspect that over half of all 800+ players are included. With a little fiddling, I can convince myself that if there are 64 million total pool players, they might have a sigma of 125 and a mean of 200. At the low end (which may have a shape that is a lot different from ideal), this simple fitting would say there are about 50 players under -400 (negative) Fargo rating. That would be the Bye family.
 

hang-the-9

AzB Silver Member
Silver Member
Wow that nails normality alright. It’s funny because I would expect pool ability to be positively skewed, with a floor where most non-players/beginners sit, and then a small number with very high scores. Maybe it’s the log transformation that skip100 mentions that makes it normal.

Mean = 500 and sd = 100 has a nice ring to it. Makes it easy to estimate your percentile. That’s the same as the SAT, at least in the past.

Remember this is for players that are in Fargo, which means that many would have good skill already to play in events that Fargo has results from. If this was EVERYONE that plays pool, then you would see a lot more lower ranked players. Many of the "bad" players rated by Fargo would be pros compared to their friends that don't play.

The fact that the more games you have in the system the higher the average is also makes sense.
 

mikepage

AzB Silver Member
Silver Member
Remember this is for players that are in Fargo, which means that many would have good skill already to play in events that Fargo has results from. If this was EVERYONE that plays pool, then you would see a lot more lower ranked players. Many of the "bad" players rated by Fargo would be pros compared to their friends that don't play.

The fact that the more games you have in the system the higher the average is also makes sense.

Yes, agreed.

If you look at the state of MA, where you are from, there is data that comes in from the tournament scene and tends to be for stronger players. But there is also a lot of data that comes in from league and particularly a league that is friendly and welcoming to newer players, USAPL. The net result is there are over 1,000 players in MA with established rating. The average rating is 438, and the standard deviation is 102.

When we start getting more and more league data in from all over, distributions elsewhere will start to look more like this.
 

Attachments

  • madist.png
    madist.png
    44.3 KB · Views: 282
Last edited:

Dan_B

AzB Gold Member
Gold Member
Silver Member
...man!!
I wish these graphs would fit my screen … :rolleyes:


ahhh, nice plus 25 on my end, perfect...
 
Last edited:
Top