So I got my QMD and have been fooling around with it a little. The device weighs 34 grams and attaches pretty easily to the cue. The software download (I am using an LG tablet) went fine and there was no problem linking the QMD to the tablet via bluetooth.
Then I took a few shots. I left all of the settings at their defaults.
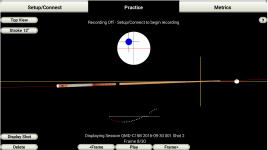
After a shot the display keeps cycling through the output for that shot. What it shows is a cue going back and forth with a graph showing something. Velocity? It also shows an image of a ball with a tip and crosshairs centered which also moves as the display cycles through the shot over and over.
If I click on the metrics button I get a list of shots with a set of numbers for each shot. Some of the numbers are red, indicating that on those measures the performance was outside of the acceptable range.
The numbers divide into three categories, lateral motion, vertical motion, and roll. Each has 2 different numbers, one indicating the range of that kind of motion through the stroke, and the other indicating the same thing at the moment of impact.
On the 4 shots I recorded, all of my lateral and vertical numbers were within the acceptable range. But all of my roll numbers were in the red. My ranges were all weighted on the negative side, and all of the roll readings at impact showed roll to the right in the 10 to 18 (degrees?) area.
So, what does it all mean? Unfortunately the material on interpreting the results is a little skimpy so I hope someone who is more familiar with these kinds of things than I am can provide some interpretive help on what these results mean.
What does the graph show? What does a graph of a "good" shot look like. What do the numbers mean. What exactly is roll? Does it need to be fixed? How do I fix it?
Thanks.
Then I took a few shots. I left all of the settings at their defaults.
After a shot the display keeps cycling through the output for that shot. What it shows is a cue going back and forth with a graph showing something. Velocity? It also shows an image of a ball with a tip and crosshairs centered which also moves as the display cycles through the shot over and over.
If I click on the metrics button I get a list of shots with a set of numbers for each shot. Some of the numbers are red, indicating that on those measures the performance was outside of the acceptable range.
The numbers divide into three categories, lateral motion, vertical motion, and roll. Each has 2 different numbers, one indicating the range of that kind of motion through the stroke, and the other indicating the same thing at the moment of impact.
On the 4 shots I recorded, all of my lateral and vertical numbers were within the acceptable range. But all of my roll numbers were in the red. My ranges were all weighted on the negative side, and all of the roll readings at impact showed roll to the right in the 10 to 18 (degrees?) area.
So, what does it all mean? Unfortunately the material on interpreting the results is a little skimpy so I hope someone who is more familiar with these kinds of things than I am can provide some interpretive help on what these results mean.
What does the graph show? What does a graph of a "good" shot look like. What do the numbers mean. What exactly is roll? Does it need to be fixed? How do I fix it?
Thanks.