Cue Ball and Object Ball Travel Distances Plot

Colin Colenso

AzB Silver Member
Silver Member
Following up on the discussion in this thread, I've completed what I believe to be an accurate plot of travel distances for the Cue Ball and Object Ball for the full range of cut angles.

I've chosen 12 as the base unit. That could be 12 diamonds, 12 feet or 12 inches. I chose this because it is quite typical distance and it divides well for some easily memorized rules of thumb.

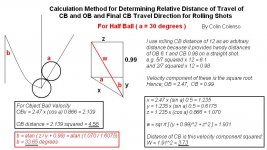
eg.For a rolling ball that would travel 12 feet unobstructed, if it hits an object ball full in the face at the beginning of its journey, it will hit the object ball 6.1 feet, approximately 1/2 and the Cue Ball will roll forward 0.98, or approximately 1/6th the distance the OB will travel.

This 1/6th ratio is very useful as a guide when playing rolling pots. For example, when you want to roll a straightish pot in, and the pocket is 3 feet away, you would likely aim to hit with a rolling distance of about 4 feet. If you can hit the OB that far, the CB will roll very close to 4/6th of 1 foot = 8 inches. 8 foot OB would be 8/6ths or 16 inches. These are the distances from where the CB was upon impact.

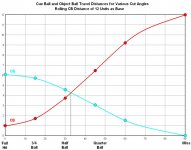
The chart below provide us with some other useful rules of thumb.

1. A hit of about 33 degrees (slightly thinner than 1/2 ball) will make the CB and OB travel the same distances. This can be a handy guide for hooking opponents.

2. From full to 3/4 ball hit (approx 14 degrees) the CB will only change from 1 up to about 1.8 feet for the OB travelling 6 feet. That's 1/6th to a bit less than 1/3rd. So by judging the fullness of shot, as compared to Full ball and 3/4 ball, you should be able to estimate CB travel distance to within a couple of inches. eg. 10 degrees will be around 1/4.

Some useful rules of thumb are:

Full Ball = 1/6
5 degrees = 1/5
10 degrees = 1/4
15 degrees
(slightly thinner than 3/4 ball) = 1/3
20 degrees = 1/2
33 degrees = 1
45 degrees
(slightly thicker than quarter ball) = 2:1
60 degrees = 6:1


These relate to the proportianal travel distances of the CB and OB.​

Thanks to JAL, Dr. Dave, jsp and others for helping me work this out.

Note: Calculation method is shown in post #22 below. Click here to go straight to it.

Colin
 

Attachments

  • CB + OB Roll Plot.jpg
    CB + OB Roll Plot.jpg
    87.1 KB · Views: 502
Last edited:
Thanks and a couple of suggestions

Colin,

Thanks for the chart, the curves aren't intuitive which makes the chart far more valuable than if they were. Perhaps purely by coincidence, the lines appear very similar as those generated by the effects of wind speed and direction on a bullet's flight however. I don't know if there is any connection at all, I'd have to give that more thought if it mattered.

My two suggestions are to add degree marks to your bottom scale line and to indicate the value of the line you dropped down from the intersection of the two curves. Not major issues but I do believe that the changes would add to the readability of the chart.

Thanks very much to you and your collaborators for creating this. Very helpful to those of us that are visually oriented.

Hu
 
ShootingArts said:
Colin,

Thanks for the chart, the curves aren't intuitive which makes the chart far more valuable than if they were. Perhaps purely by coincidence, the lines appear very similar as those generated by the effects of wind speed and direction on a bullet's flight however. I don't know if there is any connection at all, I'd have to give that more thought if it mattered.

My two suggestions are to add degree marks to your bottom scale line and to indicate the value of the line you dropped down from the intersection of the two curves. Not major issues but I do believe that the changes would add to the readability of the chart.

Thanks very much to you and your collaborators for creating this. Very helpful to those of us that are visually oriented.

Hu

Glad you got something out of this Hu. I'm sure I'll be using these rules of thumb quite a bit, as I've used the 1/6th rule of thumb quite often since I learned it.

I'll label the graph in more detail when I'm sure there are no errors. Just want to get some feedback first.

According to Dr. Dave's paper http://billiards.colostate.edu/technical_proofs/new/TP_A-16.pdf the lines should cross at 33.21 degrees cut, which is pretty much what my lines showed.

I calculated my values for the 6 positions using trigonometric type methods, quite different to the vectorial equations Dr. Dave and JAL use, but I seem to get the same results. But it is time consuming to make many calculations to find the exact similar points using my basic math skills.

Main thing it is has developed a pretty close fit curve, that I hope is easy to understand, which provides some insight and some handy rules of thumb.

Colin
 
Last edited:
a great visual aid

Colin,

The lines between the points don't have to be scientifically perfect as long as they are in the right neighborhood to get the point across. What I gain is that there are large areas where speed transfer is roughly equal and other areas where the change in transfer rates is rapid. That could affect something like choosing to make a ball in the corner or side pocket if both are options. Bank or straight in? Natural banks are simple enough that I sometimes choose them for shape. Considering your rules of thumb could be a help there also.

Hu


Colin Colenso said:
Glad you got something out of this Hu. I'm sure I'll be using these rules of thumb quite a bit, as I've used the 1/6th rule of thumb quite often since I learned it.

I'll label the graph in more detail when I'm sure there are no errors. Just want to get some feedback first.

According to Dr. Dave's paper http://billiards.colostate.edu/technical_proofs/new/TP_A-16.pdf the lines should cross at 33.21 degrees cut, which is pretty much what my lines showed.

I calculated my values for the 6 positions using trigonometric type methods, quite different to the vectorial equations Dr. Dave and JAL use, but I seem to get the same results. But it is time consuming to make many calculations to find the exact similar points using my basic math skills.

Main thing it is has developed a pretty close fit curve which provides some insight and some handy rules of thumb.

Colin
 
Colin Colenso said:
Glad you got something out of this Hu. I'm sure I'll be using these rules of thumb quite a bit, as I've used the 1/6th rule of thumb quite often since I learned it.

I'll label the graph in more detail when I'm sure there are no errors. Just want to get some feedback first.

According to Dr. Dave's paper http://billiards.colostate.edu/technical_proofs/new/TP_A-16.pdf the lines should cross at 33.21 degrees cut, which is pretty much what my lines showed.

I calculated my values for the 6 positions using trigonometric type methods, quite different to the vectorial equations Dr. Dave and JAL use, but I seem to get the same results. But it is time consuming to make many calculations to find the exact similar points using my basic math skills.

Main thing it is has developed a pretty close fit curve, that I hope is easy to understand, which provides some insight and some handy rules of thumb.

Colin

Colin,

I'm sorry sir, I know you are well intentioned, but applying engineering principles to pool balls, and rails, just does not work. The variables are infetismal. You may come closer to a guy who is just guessing, but you will never approach the accuracy of a skilled pool player. IMHO. :rolleyes:

Dick
 
SJDinPHX said:
Colin,

I'm sorry sir, I know you are well intentioned, but applying engineering principles to pool balls, and rails, just does not work. The variables are infetismal. You may come closer to a guy who is just guessing, but you will never approach the accuracy of a skilled pool player. IMHO. :rolleyes:

Dick
Dick,

Thanks for the lesson. Maybe you can pass it on to all the guys that are banking and kicking using systems.:eek:

Colin
 
Colin,
Interesting info. I am not questioning the results, but I do have a question. Since a moving cue ball has X amount of directional energy, and when it collides with the ob, some of that energy is transferred to the ob, one would tend to assume that the combined distance the two balls would travel would be the original (12 units). Where would you think the missing energy goes?
Steve
 
pooltchr said:
Colin,
Interesting info. I am not questioning the results, but I do have a question. Since a moving cue ball has X amount of directional energy, and when it collides with the ob, some of that energy is transferred to the ob, one would tend to assume that the combined distance the two balls would travel would be the original (12 units). Where would you think the missing energy goes?
Steve
Steve,
It turns out that kinetic energy remains constant. Ke = 1/2 mv2. Distance of travel is proportion to the square of velocity. So additional distances change. And note that this is for a rolling CB, distances would be different for a sliding CB.

Check the thread linked to in the first post to see the technical proofs. Hard brain work though, so above is the layman's explanation.

Colin
 
splitting hairs here

pooltchr said:
Colin,
Interesting info. I am not questioning the results, but I do have a question. Since a moving cue ball has X amount of directional energy, and when it collides with the ob, some of that energy is transferred to the ob, one would tend to assume that the combined distance the two balls would travel would be the original (12 units). Where would you think the missing energy goes?
Steve


Steve,

I am splitting hairs here but this is why we have never perfected a true perpetual motion machine. There is never a perfectly complete transfer/retention of energy. In the case of pool ball collisions energy is wasted in the flex and return to shape of the balls, heat from friction and the flexion, and sound. I may be missing some things because an engineer or scientist I ain't but when we fully calculate retention and transfer of energy between two objects the answer will never be 100%.

Hu
 
Thank you Colin this a very useful chart. If you need to make major changes please let us all know. I will print and use for practice sessions. Nothing like a little real world experience guided by theory to improve one's game.

A fellow on another board said, "It is not a game, it is a life style." and I think I am beginning to appreciate that.

Edit, if anyone else prints in MS Word, be sure to resize the image for portrait mode.

One more request:

Can I use this figure in a publication with the source acknowledged?
 
Last edited:
JoeW said:
Thank you Colin this a very useful chart. If you need to make major changes please let us all know. I will print and use for practice sessions. Nothing like a little real world experience guided by theory to improve one's game.

A fellow on another board said, "It is not a game, it is a life style." and I think I am beginning to appreciate that.

Edit, if anyone else prints in MS Word, be sure to resize the image for portrait mode.

One more request:

Can I use this figure in a publication with the source acknowledged?

Sure Joe,

Feel free to use it.

Hopefully it won't need any changes. It seems to accord with data Dr. Dave provided, though his graphs took on a different form.

Colin
 
ShootingArts said:
Steve,
In the case of pool ball collisions energy is wasted in the flex and return to shape of the balls, heat from friction and the flexion, and sound. I may be missing some things because an engineer or scientist I ain't but when we fully calculate retention and transfer of energy between two objects the answer will never be 100%.

Hu

Actually, these charts do not take into account frictional and restitutional losses between the balls on impact. Of course, the balls lose all their energy on the cloth and that is known to occur in proportion to the square of velocity.

The chart doesn't use any particular velocity, nor any measurement of friction. It just creates ratios. These ratios would be similar over 120 feet (with no rails) or if played on a glass surface.

Where thee straight shot ratio is calculated at 6.1 to 0.98, frictional forces would probably make this closer to 5.8 to 1.0 in reality. The friction of the OB tends to pull the CB with it a little and the OB will lose some additional velocity due to imperfect restitution. (Maybe some collision experts can explain this more clearly than I.)

A couple of rough ramp tests came to very close measurements to the ratios predicted by this method. So it would seem the rules of thumb are pretty close in real conditions.

Anyway, the main point is that maybe only 2% of the kinetic energy of the system is lost in the actual collision.

Colin
 
Colin Colenso said:
Actually, these charts do not take into account frictional and restitutional losses between the balls on impact. Of course, the balls lose all their energy on the cloth and that is known to occur in proportion to the square of velocity.

The chart doesn't use any particular velocity, nor any measurement of friction. It just creates ratios. These ratios would be similar over 120 feet (with no rails) or if played on a glass surface.

Where thee straight shot ratio is calculated at 6.1 to 0.98, frictional forces would probably make this closer to 5.8 to 1.0 in reality. The friction of the OB tends to pull the CB with it a little and the OB will lose some additional velocity due to imperfect restitution. (Maybe some collision experts can explain this more clearly than I.)

A couple of rough ramp tests came to very close measurements to the ratios predicted by this method. So it would seem the rules of thumb are pretty close in real conditions.

Anyway, the main point is that maybe only 2% of the kinetic energy of the system is lost in the actual collision.

Colin

Hu, You guys are way too advanced mathematically for me. But isn't what you all are saying, somewhat like the old golf addage. " Its a proven fact that
90% of all putts, left short, don't go in the hole". ;)

Dick
 
Last edited:
R&d

Dick,

I made my living in R&D and an engineering department of a nuke for a few years so splitting hairs comes naturally, sometimes it was even a must. I was just trying to explain why the numbers after the collision can't add up to the numbers before the collision so someone doesn't disregard the information due to that. As Colin says this is only a "rule of thumb" thing to help folks get started on figuring the roll after a hit.

I see Colin's rules of thumb as one more aid when I get that shot that I just can't visualize for whatever reason and have to grind on and work out. It's not going to give us consistent pinpoint shape but it should produce pretty decent area shape. I don't think anything but a lot of hours on the table will bring back the kind of speed control I am seeking but I'll welcome any aids that may shorten that up a little.

Hu


SJDinPHX said:
Hu, You guys are way too advanced mathematically for me. But isn't what you all are saying, somewhat like the old golf addage. " Its a proven fact that
90% of all putts, left short, don't go in the hole". ;)

Dick
 
Colin Colenso said:
Sure Joe,

Feel free to use it.

Hopefully it won't need any changes. It seems to accord with data Dr. Dave provided, though his graphs took on a different form.

Colin

Colin,

Great graph.

A technical question for you about the results.

Did you test the differences that may be apparent when using different sized cue balls? I like to play with the measles cue ball, as the one I have is relatively new, and its rolling characteristics and squirt when shooting with english is reduced compared to an old, undersized red circle ball.

Can you say if there is a range for cue ball travel after the hit that depends on the weight and size of the cue ball, as well as it's surface characteristics, such as a highly polished and waxed cue ball vs. a dirty, pitted and cratered moon rock?

Thanks.

Flex
 
SJDinPHX said:
Colin,

I'm sorry sir, I know you are well intentioned, but applying engineering principles to pool balls, and rails, just does not work. The variables are infetismal. You may come closer to a guy who is just guessing, but you will never approach the accuracy of a skilled pool player. IMHO. :rolleyes:

Dick

Dick, you're certainly right that a skilled player's "feel" for distance and speed can't be approached by an unskilled player with a chart, but I think that misses the point - the chart is a learning tool that helps the unskilled player more quickly and easily develop that feel. I know it doesn't seem kosher to us old guys who had to learn it without the aid of charts and graphs by the well-worn seat of our pants - but, hey, who said anything about fair? :D

pj
chgo
 
Colin, thanks for the valuable tool. Can you think of an easy way to do one for a sliding CB? If I'm not mistaken, a sliding CB travels the same distance as the OB at a 45-degree cut rather than a 30-degree (half ball) cut.

Maybe Dr. Dave or Ron Shepard have already plotted this...

pj
chgo
 
The Calculation Method

Here is the calculation method I used for those interested.

btw: You can also use the figures to calculate the final CB travel direction.

Colin
 

Attachments

  • CB Roll Calculations.JPG
    CB Roll Calculations.JPG
    77.2 KB · Views: 191
Flex said:
Colin,

Great graph.

A technical question for you about the results.

Did you test the differences that may be apparent when using different sized cue balls? I like to play with the measles cue ball, as the one I have is relatively new, and its rolling characteristics and squirt when shooting with english is reduced compared to an old, undersized red circle ball.

Can you say if there is a range for cue ball travel after the hit that depends on the weight and size of the cue ball, as well as it's surface characteristics, such as a highly polished and waxed cue ball vs. a dirty, pitted and cratered moon rock?

Thanks.

Flex
Hi Flex,
Haven't tested or attempted calculations for different weighted balls. That gets a bit more complex, but I'd think something like, if the CB is 3% lighter, the end distance would be 6% less. But then again the OB would have to be hit harder, so might be closer to the percentage weight difference. Maybe I'll do this another time. I play some English 2 shot and our CB is about 10% lighter so these rules don't work too well.

As for dirty pitted balls, I'd need some testing but there are a couple of considerations.
1. The OB will pull the CB with it more = more CB distance and less OB distance.
2. The OB will get some transferred backspin making it travel less distance, this will be taken away from the CB's angular momentum. I'm not sure if these two cancel out.

Colin
 
Back
Top