How does Fargo percentiles look?

JC

Coos Cues
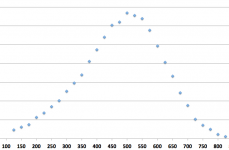
Does any one have the data or know how this breaks down?

What scores correlate to what percentile of players with an established rating?

Where is the cut off score wise for the top 10%? 20% etc.

I'm curious how the curve looks.

I apologize if this has been posted in a thread here already, I didn't find it with moderate searching.

Mike Page?

Thanks

JC
 
[...]
I'm curious how the curve looks.

[...]

Players in the system now are distributed like this. Be aware though, that better players are more likely to have games in. So as the number of players in the system grows expect the left side to be bumped up and the peak to move to the left.
 

Attachments

  • Screen Shot 2016-06-23 at 9.21.42 AM.png
    Screen Shot 2016-06-23 at 9.21.42 AM.png
    22.5 KB · Views: 369
Players in the system now are distributed like this. Be aware though, that better players are more likely to have games in. So as the number of players in the system grows expect the left side to be bumped up and the peak to move to the left.

I am having trouble ascertaining what I was wondering from that graph.

I think maybe the word curve wasn't exactly the right thing for me to say. What got me thinking about this is a comment someone made in a thread about the percentage of all established players that were above 600 which apparently was commented on by a commentator on a streamed match. So to break it down by percentile of course this means at a given score, what percentage is less than you and what percentage more. That's the data I was really curious of. The graph gives an idea but not the statistic. Plus for it to be meaningful at this point one would have to include only players with a robustness that makes them an established player. Obviously this will change over time as more players become established.

I think it would be a cool calculator to add to the fargo rate site. Enter your score and it returns a percentile number that you rank worldwide, current with the ever changing data base.

Thanks,

JC
 
I am having trouble ascertaining what I was wondering from that graph.
...
It's possible to do what I think you want to do but it's a little tricky. What I'm pretty sure is shown is the histogram of ratings so the vertical axis is percentage of players with a rating within +-12.5 rating points of the indicated value. A quick estimate gives a vertical scale of 1.3% per division. Adding up the top ratings, I find that about 3% of players have a rating of 700 or higher. The curve is roughly symmetrical around the peak, with a little skew to the left, so the 50th percentile is around 480.
 
Players in the system now are distributed like this. Be aware though, that better players are more likely to have games in. So as the number of players in the system grows expect the left side to be bumped up and the peak to move to the left.

Excellent chart, Mike. Good information.
 
Back
Top