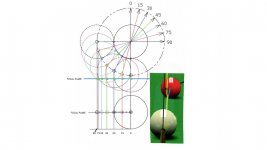
I've mentioned how the angles crowd together in the last quarter of the cue ball and I've been looking for a good picture to describe it. The only thing I can find is something off an old analog computing device, the S scale of a slide rule. It's the bottom row of lines on the body of the rule.
The black lines are the sine values mapped to a straight line, like a cue ball radius for instance. The values are linear to a certain distance then begin to get much closer at the end of the scale, like a cue ball's edge for example. The black numbers are for the sine, the red for cosine.
View attachment 443933
The spacing between the lines is pretty regular and the proportions between angles are about the same distances apart. 15* is 1/4 ball, 30* is half ball. 10* is 1/6 ball, 20* is 1/3 ball, 40* is 2/3 ball. Around 50* the marks start getting closer together and around 70* become even more compressed. A little distance goes a long way here.
If you imagine the scale of the rule and shrink it down to fit on a cue ball radius, you see the physical distance is very small. The tangent lines don't dance very much with table position but they use a very small dance floor. Hope you found it interesting.
For the purists: You'll notice the scale doesn't start at 0*. An expanded ST scale is used for small angles to get the tangent and sine values where they are almost equal. Consult Wiki for more slide rule facts if interested. They're as easy as falling off a 'log'.
https://en.wikipedia.org/wiki/Slide_rule
Here is a visual of crowding:

