[...]how accurate, fair , close, etc ( overall ) is Fargo Rate in assigning and maintaining handicaps ( spreads ).
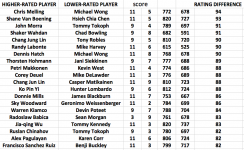
OK. I think this is what you want. I've got 380 matches in the last two tournaments (US Open and WPS) between opponents with established Fargo Ratings. I can sort them by rating difference and see how the scores match up with the expectations. Of course if I had 4000 matches instead of 400, things would work out a lot better. But I think you'll get the idea here.
Here is the plan. Look at each score in a race to 11 individually, like for example, 11 to 8.
(1) find the rating difference associated with the score: For 11-8 it is 46 points.
(2) Find the 20 matches with a rating difference closest to 46 points. This includes matches with a rating difference ranging between 40.4 and 52.7.
(3) Find how many games the lower-rated players won for each 11 games the higher-rated players won and compare that to the expectation, in this case to 8. The answer here is 7.6.
Repeat the above for other scores. Here are the results
11 to 3 -- expect 3, get 3.1
11 to 4 -- expect 4, get 3.9
11 to 5 -- expect 5, get 5.9
11 to 6 -- expect 6, get 6.1
11 to 7 -- expect 7, get 6.8
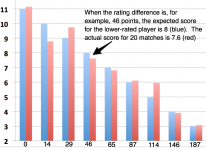
11 to 8 -- expect 8, get 7.6
11 to 9 -- expect 9, get 9.7
11 to 10 -- expect 10, get 8.8
11 to 11 -- expect 11, get 11.1
Here is a plot of these