For the past month I've been playing nothing but straight pool every day, in an attempt to reach my goal run of 50. This is a very lofty goal, as I'm a high C/low B 9 ball player. I haven't played straight pool on a regular basis since I first learned to play, about 20 years ago.
I've been keeping a detailed spreadsheet of every run attempt. I've also been video recording every attempt. Each run starts from one of the standard break shots that come up in an actual game (not the one where the OB is hanging in the side pocket). Today, I got to 350 run attempts (innings) and decided to calculate my actual chance of reaching my goal of 50. I must say, I'm a bit sad at the number
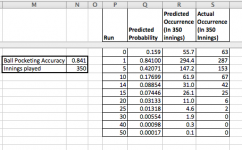
The first picture is a summary of what my probabilites are for each run goal, and also how often they actually occurred in my attempts. I think my actual results follow the predictions fairly well. Of note, missing the first ball (run of 0) happened more often than predicted. This is to be expected imo, because the break shot is harder than most other shots. However, I expected to see the same trend on a run of 15 (second break shot), but did not.

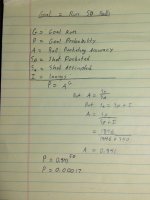
The second picture is the math behind the spreadsheet. Thanks to Bob Jewett's two articles which I used for reference:
Jewett Article 1
Jewett Article 2

I've been keeping a detailed spreadsheet of every run attempt. I've also been video recording every attempt. Each run starts from one of the standard break shots that come up in an actual game (not the one where the OB is hanging in the side pocket). Today, I got to 350 run attempts (innings) and decided to calculate my actual chance of reaching my goal of 50. I must say, I'm a bit sad at the number
The first picture is a summary of what my probabilites are for each run goal, and also how often they actually occurred in my attempts. I think my actual results follow the predictions fairly well. Of note, missing the first ball (run of 0) happened more often than predicted. This is to be expected imo, because the break shot is harder than most other shots. However, I expected to see the same trend on a run of 15 (second break shot), but did not.

The second picture is the math behind the spreadsheet. Thanks to Bob Jewett's two articles which I used for reference:
Jewett Article 1
Jewett Article 2

Last edited: